Gnuplot 笔记
gnuplot是一个免费的命令行的绘图软件,在Linux,Windows,OSX等平台都有支持, 虽然叫做gnuplot但它并未使用GPL协议,而是使用自己的开源协议发布(感谢goodgoodlivetodown网友勘误)。 小编曾用它绘制了毕业论文中数百张复杂的脉冲星检测分析图。现在总结一下它的使用方法备忘。
Gnuplot is a portable command-line driven graphing utility for Linux, OS/2, MS Windows, OSX, VMS, and many other platforms. The source code is copyrighted but freely distributed (i.e., you don't have to pay for it). It was originally created to allow scientists and students to visualize mathematical functions and data interactively, but has grown to support many non-interactive uses such as web scripting. It is also used as a plotting engine by third-party applications like Octave. Gnuplot has been supported and under active development since 1986. –Gnuplot
安装
gnuplot、gnuplot-x11(可输出至X11)
帮助
$ gnuplot
gnuplot> help some_command
示例
# 文件
set term postscript eps enhanced size 3.7,5 #enhanced 使用增强文本,size 图的大小(英寸),terminal默认为wxt(X11)
set output "psr.eps"                        # 输出文件名

# 坐标轴
set xlabel "Period (s)"                     # x轴label
set logscale x                              # 设x轴为对数坐标
set xtics 1e-9,-1000,1e-24                  # x轴标度范围
# set xtics (2,4,6,8,10)
set xr [0.001:20]                           # x轴范围
set ydata time                              # 设y轴数据为时间
set timefmt "%H:%M:%S"                      # 设置时间格式
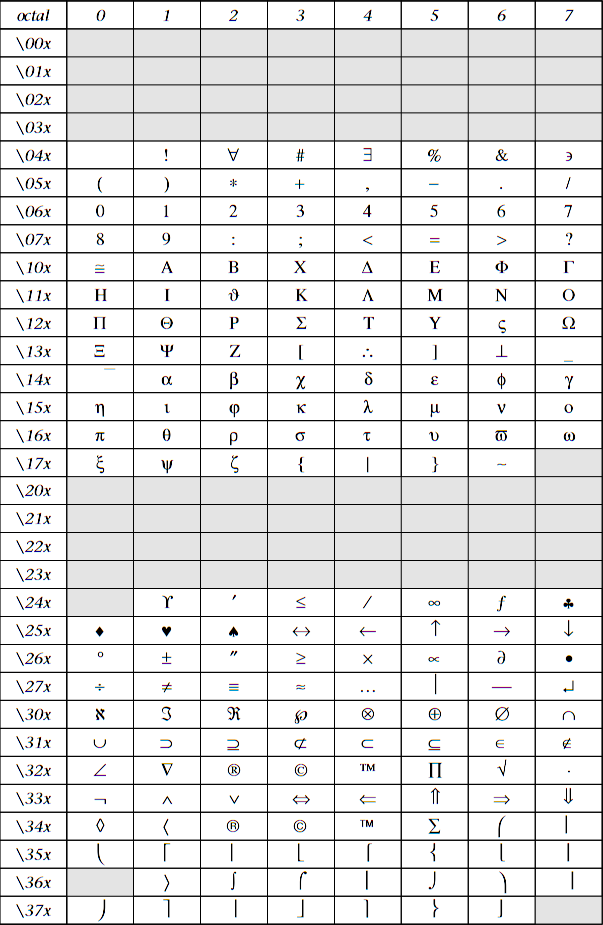
set format y "%g{/Symbol \260}"             # y轴标度格式

# 标注
set key 0.01,100                            # legend位置
# unset key                                 # 取消legend
set arrow from 0.1,2 to 0.2,3               # 箭头
set label "peak" at 0.01,10 rotate by 10    # 标签

# 变量
a=3*2**3

# 数据文件作图
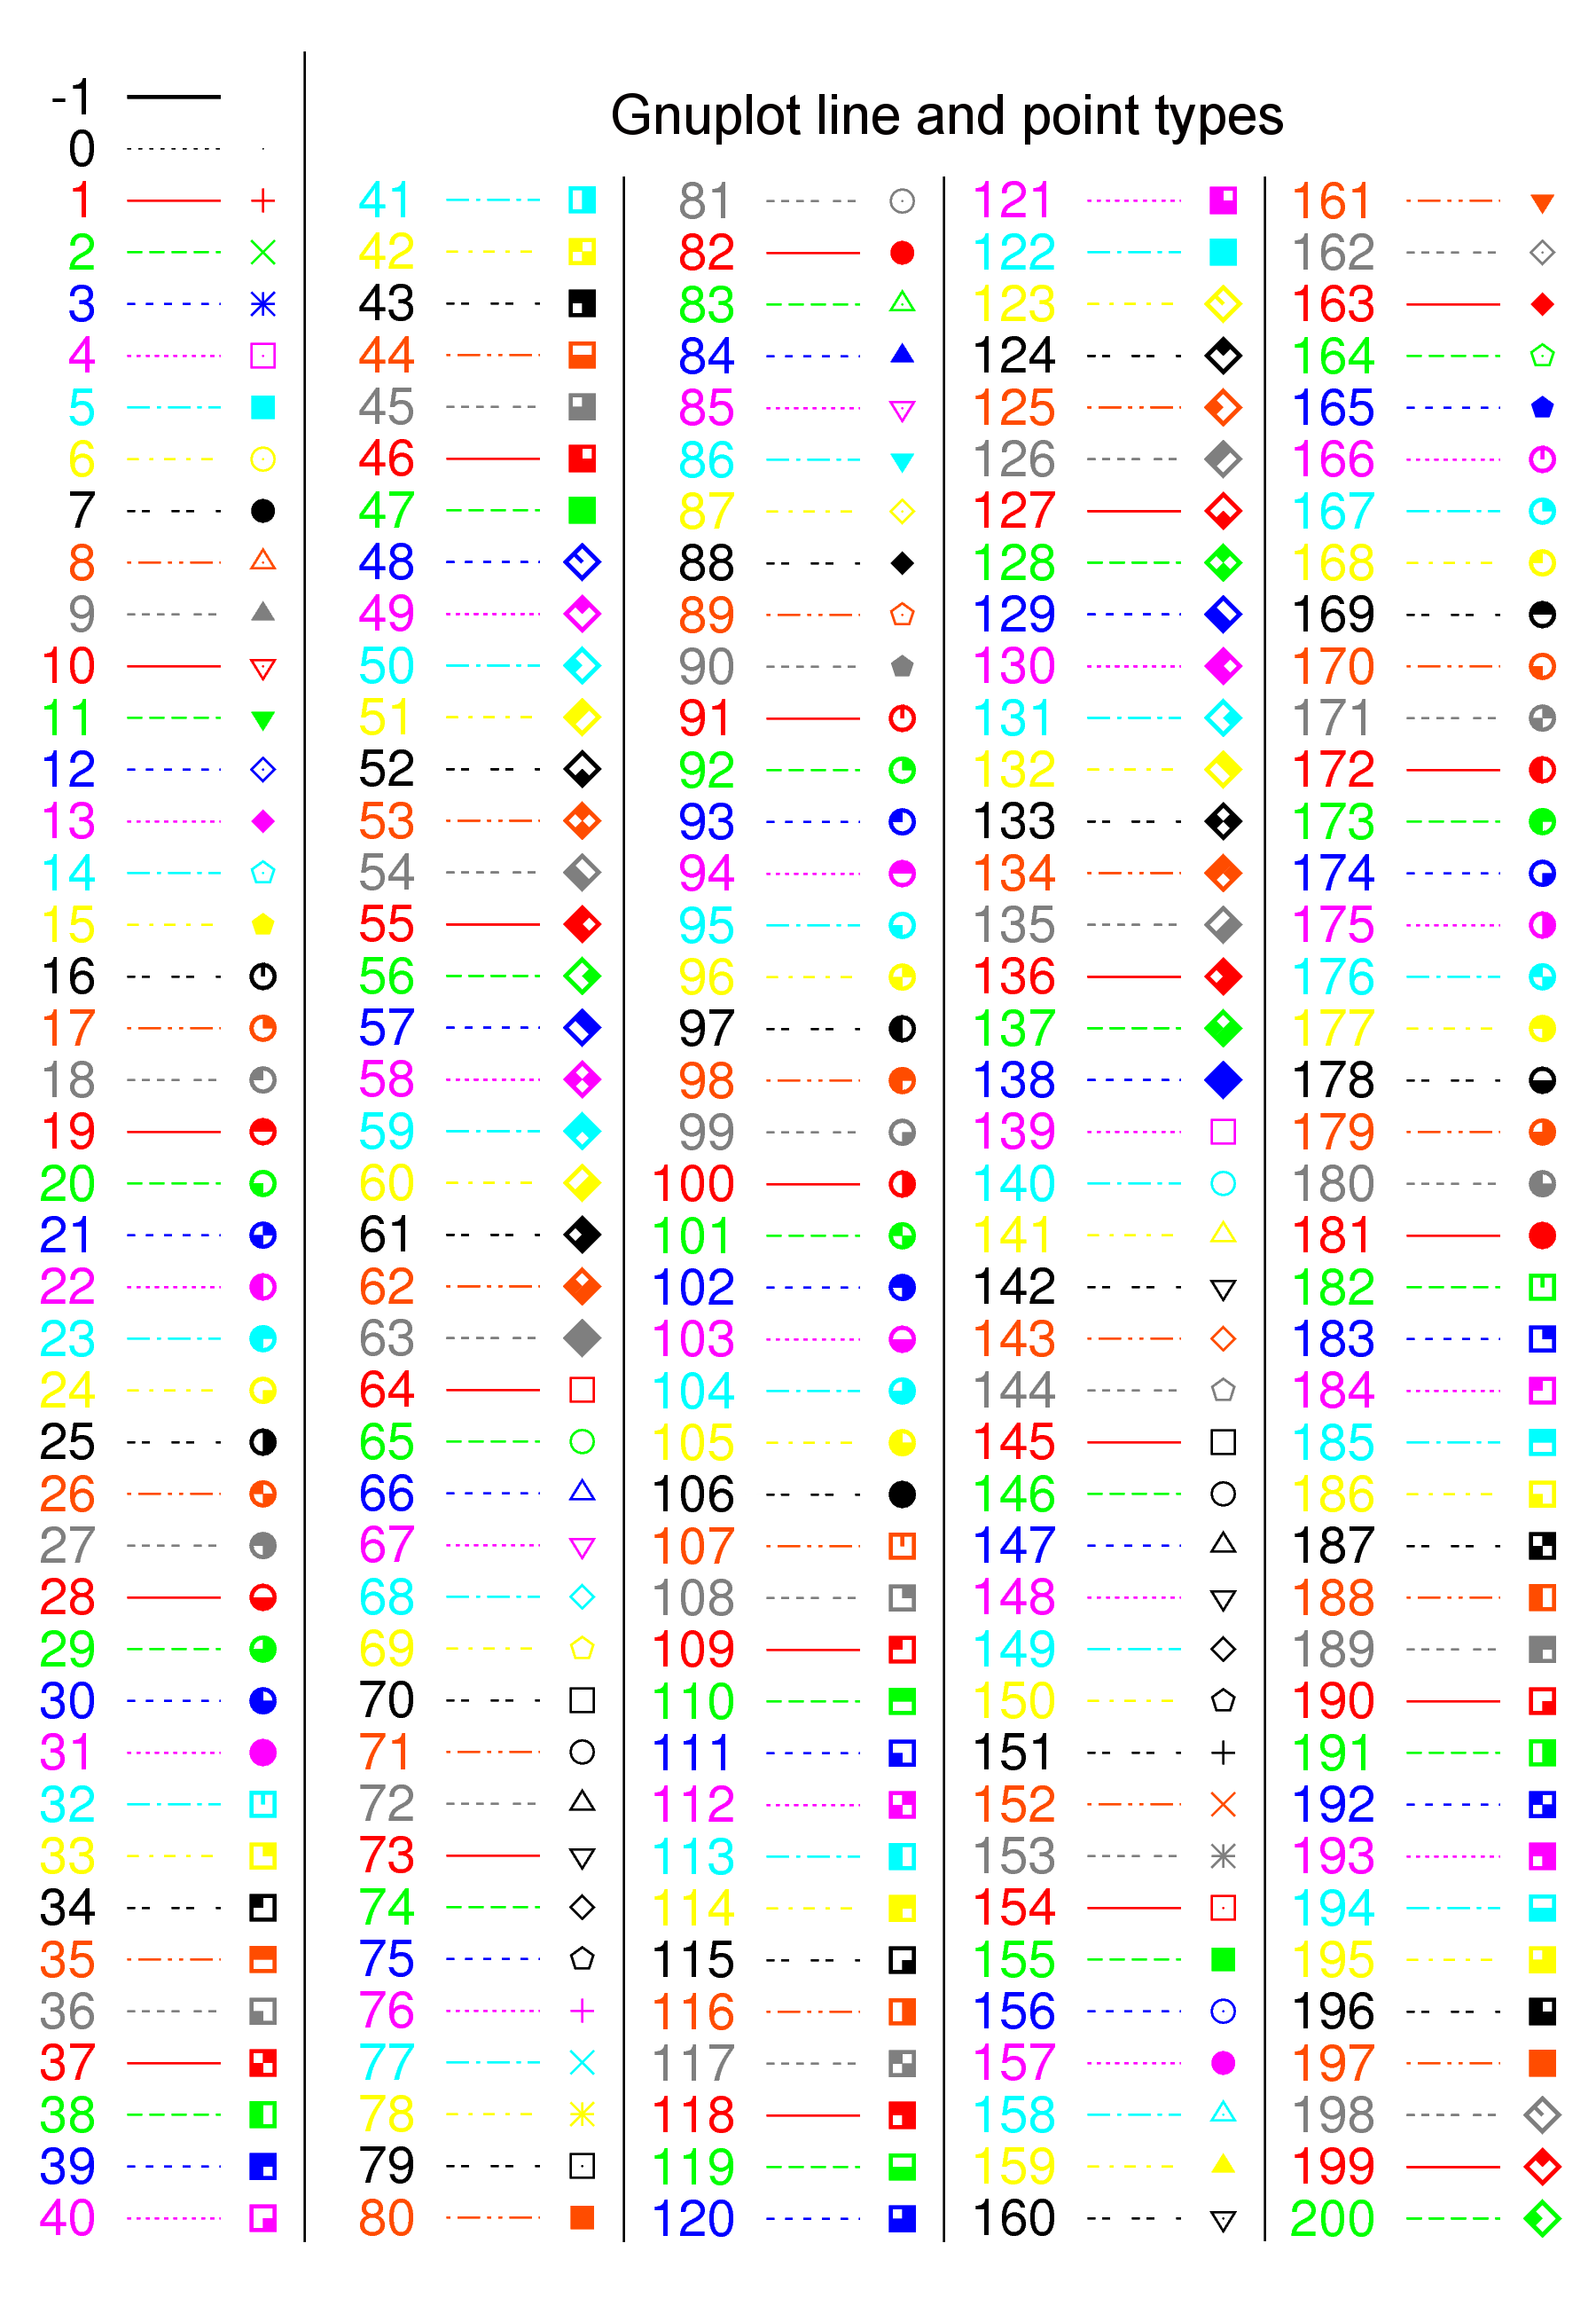
plot "a.dat" using 1:2 title 'relation' with points pointtype 6 linetype rgb "red" pointsize 1,\
# 函数做图
plot x**2    using 1:2 title 'xxxxxxxx' with line linetype 5
文件转换
eps->pdf(否则直接插入tex中enhance文本会显示异常)
epstopdf    *.eps
pdflatex    *.pdf
运算符
| 符号 | 示例 | 解释 |
|---|---|---|
^ |
a^x |
上标 \superscript |
_ |
a_x |
下标 \subscript |
@ |
a@^b_c |
上标和下标同时出现 \phantom box (occupies no width) |
& |
&{space} |
插入指定宽度空白 \inserts space of specified length |
~ |
~a{0.8-} |
将后字符放在前字符的顶部 \overprints '-' on 'a', raised by 0.8 times the current fontsize |
特殊符号

点与线

本文采用 知识共享署名 4.0 国际许可协议(CC-BY 4.0)进行许可,转载注明来源即可: https://harttle.land/2015/05/16/gnuplot-note.html。如有疏漏、谬误、侵权请通过评论或 邮件 指出。